
Lesson Guide: Thunderstorm Level 2
This scenario was the first one that we developed in June 2021 for the online version of Datatown. It has been further developed in September 2021 to provide a full set of resources for Level 2 and Level 3/4.
Synopsis
- This topic helps learners to understand how sensors are used to gather information during weather events, in this case a thunderstorm.
- Learners investigate the impact of a thunderstorm on a small town, Cladach, situated on the Scottish island of Eilean Mòr. They discuss the problems a thunderstorm may cause for the island, determine which parts of the island will be most affected and consider how the storm will affect inhabitants and businesses.
- Central to this topic is the use of sensors for gathering weather data. Learners read and analyse data gathered by sensors during a real thunderstorm event. Learners also consider how data sensors may be used to help solve wider problems for Eilean Mòr arising from the thunderstorm.
- Learners will develop an understanding of how sensors contribute to the Internet of Things (IoT) – the system of interrelated computing devices, mechanical and digital machines, which transfer data over a network without requiring human intervention.
- Where possible, the PPDAC (Problem, Planning, Data, Analysis, Conclusion) protocol will be used to guide the learners through their tasks.
Resources are freely available to schools within the Edinburgh and South East Scotland City Region and are funded by the Scottish and UK Governments through the Data Driven Innovation programme. Other schools can download at present.
Further support on this and other Data Education content for schools is available at the Data Education in Schools website at https://dataschools.education.
[wpdm_package id=’2281′]
[wpdm_package id=’2283′]
Duration
40-60 minutes should be allowed for analysis and evaluation of sensor data and discussion of the impact of the thunderstorm. Extension activities may be covered in subsequent lessons.
Objectives
- To develop scientific inquiry and investigative skills.
- To introduce learners to concepts about data and its use in problem solving.
- To raise awareness of how sensors are used to gather data in the environment.
- To analyse, interpret, evaluate and present scientific findings.
Age and stage
- CfE second level
- Coverage of CfE experiences and outcomes, science benchmarks & skills development, and IDL links are shown below.
Knowledge, Understanding and Skills
- Know that sensors can be used to gather data on weather/environmental entities.
- Understand how sensor data could be used to solve a problem.
- Analyse, interpret and evaluate scientific/numeric findings.
- Present scientific findings.
Resources
- Connectivity to Learn@IOT website
- 1 or 2 internet-connected devices per group
- PowerPoint – Thunderstorms slides 1 to 22
- Map of Cladach
- Optional – data observation template V1
Lesson Plan
Activity overview
Activity 1 Learners discuss thunderstorms and identify the problems that they can create for both natural and urban environments. They learn about the various data entities gathered by sensors during a thunderstorm.
Activity 2 Learners watch the streamed video showing 3 types of data (entities) captured by different sensors during the storm. Learners make observations, interpret and evaluate findings.
Activity 3 Learners consider problems that a thunderstorm could cause for the island’s community and identify data required to help solve these problems.
Activity 4 Learners share/present their findings.
Learning Intentions
We are learning about the effects of a thunderstorm on an island community and how sensors can be used to capture weather data.
Success Criteria
We will know if we have achieved our goal if I can:
- identify problems caused by a thunderstorm
- understand how sensors collect weather data
- analyse data arising from an extreme weather event
- discuss a real-world problem that could be solved using sensors and data
- work well in a group
Task 1: Thunderstorm Introduction |
|
PowerPoint slides 2 to 12 Note: The thunderstorm video is streamed 4 times every hour. The teacher should start the video and return to it at the end of this first activity, ie around 10 minutes into the video when the thunderstorm is commencing. During the first 10 minutes of video there is no change to the weather data until the thunderstorm and heavy rain starts (at around 10 am on the timeline). The teacher should play the short online introductory video (Thunderstorm 2) which sets the scene. As a class, or in groups, learners discuss what they know about thunderstorms – causes, characteristics, effects, etc. Powerpoint slides 2 to 5 can be used to support this activity. Learners are introduced to the 3 types of data (entities) gathered by sensors during the thunderstorm that hits the Island of Eilean Mòr and the town of Cladach.
|
Task 2: Thunderstorm video and weather data |
|
PowerPoint slides 18 to 22 Learners can either view the streamed weather data as a class with the teacher leading or in groups of around 4, with 1 or 2 internet-connected devices allocated to each group. In groups learners consider the weather data produced by the 3 different sensors before and during the thunderstorm (note: the rainfall starts at around 10 am on the thunderstorm timeline). Depending on their age and stage, learners may need help reading and interpreting the data. Learners make observations about the data and identify how the data changes at different stages of the thunderstorm. Data entity templates can be used for learners to record their observations. Questions about the data:
Learners discuss their observations and draw conclusions from the data about how weather changes during a thunderstorm. Data Template V1 (students record the changes to weather data) If time is restricted, the teacher can nominate one data entity for each group to review (ie, temperature, rainfall, windspeed, etc) and the groups can share their findings and conclusions. |
Task 3: Impact of the storm on Cladach and Eilean Mòr |
|
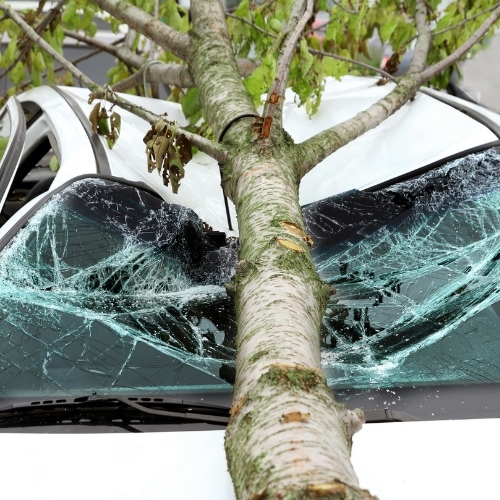
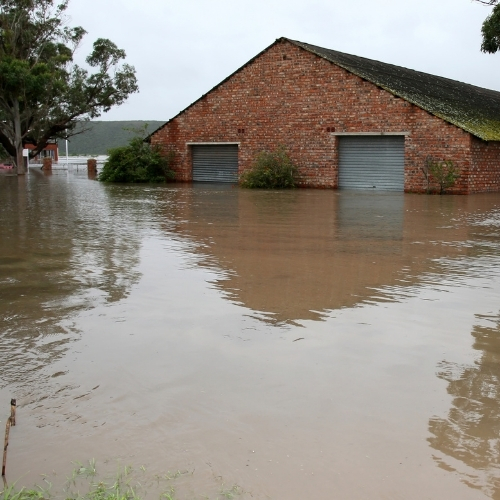
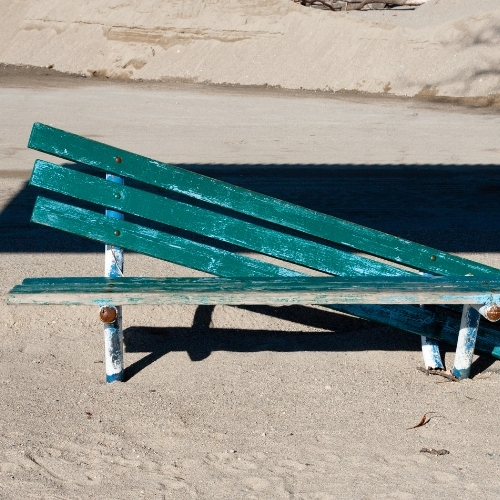
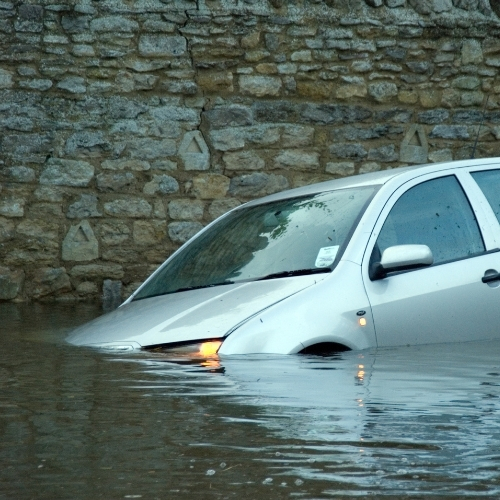
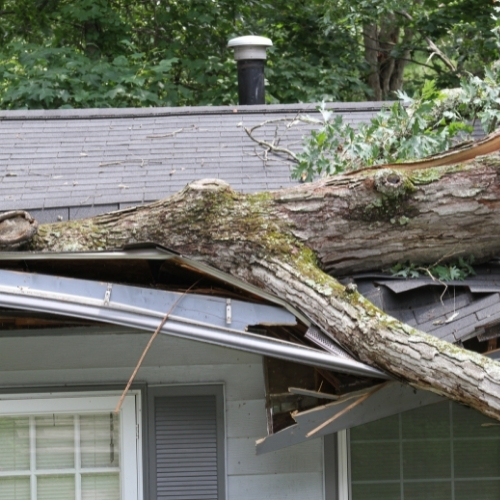
PowerPoint slides 14 to 18 The teacher plays the Thunderstorm 3 video which introduces the impact of the storm on Cladach and possible problems that it might create for the town. In their groups learners study the map of the town of Cladach, situated on the Scottish island of Eilean Mòr. They brainstorm different problems that a thunderstorm might bring to the town and its community. This might include, for example:
Each group decides on a reporter and scribe. Groups choose one of these problems and discuss it in more depth, identifying what could be done to solve the problem and what type of data would be needed to help solve the problem. |
Task 4: Plenary |
| If time allows, groups present their ideas for discussion with the rest of the class. |
Extension Work/Differentiation |
|
PowerPoint slides 18 to 22 Various activities may be undertaken to extend the lesson or create additional lessons to increase breadth/depth and promote interdisciplinary learning.
|
Assessment
-
- Observation of learner engagement during learning activities and understanding of background science.
- Questioning during the plenary.
Resources
-
- Connectivity to Learn@IOT website at https://learn.iot.ed.ac.uk
- 1 or 2 internet-connected devices per group
- PowerPoint – Thunderstorms slides 1 to 22
- Map of Cladach
- Optional – data observation template V1